This page covers the basics of the stock chart patterns and indicators I commonly reference in my stock picks.
Note: While the following is meant to give you an overall idea on the subject, it DOES NOT cover every topic in detail. To completely learn the intricacies, details, and all arounds strategies of technical analysis, check out Chart Pattern Manifest.
Stock Charts – Most online stock brokers provide quality stock charts. Most of the stock charts posted on The Wild Investor (TWI) are from StockCharts.
Technical analysis – Before reading further, understand this. Technical analysis is the action of taking trends of historical data and interpreting them into predicting probable future price action.
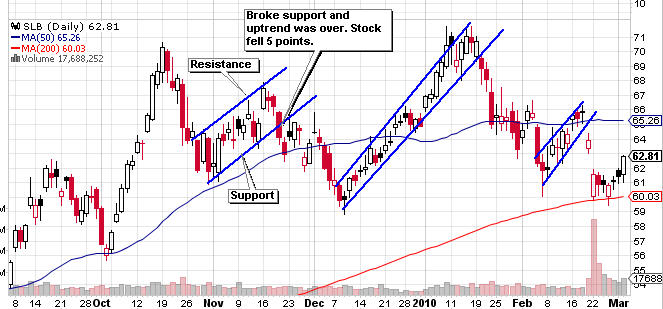
Resistance and Support
Stock prices typically don’t move straight up and down, but in what traders like to call a “range”. This range can be in downtrend, uptrend, or sideways-trend, but all of them involve the stock moving within some boundaries.
The top of this boundary is noted as the resistance and the bottom of this boundary is the support.
When the stock price moves above the resistance this is regarded as bullish sentiment. When the stock price moves below the support this is known as a bearish sentiment.
Following up on this same idea, when the stock price bounces off the resistance and heads lower this is looked at as a bearish move. A stock that bounces off the support and heads higher indicates a bullish move.
Ultimately, resistance and support is the basis for which most stock chart patterns are based off of. They also help determine the current trend of a stock and when it has been broken.
Moving Averages
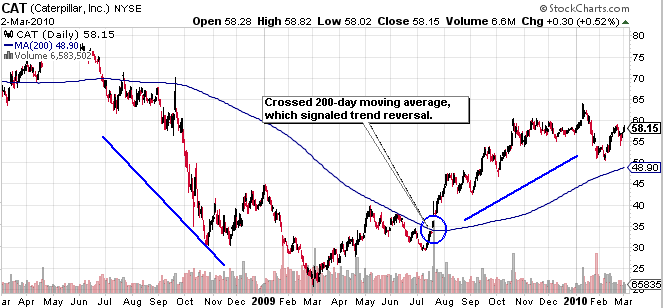
Remember that technical analysis is the idea of using historical trends to predict future trends. The moving average is the average of a stock’s price over a particular term.
Users can input any time length for a moving average. The more popular ones include: 20-day, 50-day, and 200-day moving averages.
Moving averages can be used as a form of support and resistance depending on their relation to the stock. The longer the time frame; the more importance that should be given to a crossing above or below the moving average.
For example, a crossing of a stock’s price above the 200-day moving average should be seen as a major trend reversal. Whereas a crossing above the 20-day moving average can be seen as just a short-term trend reversal with no major implications on the long-term trend.
Using the above theory, short-term traders tend to use shorter time frames and long-term traders use longer time frames to analyze price movement.
The moving average basically gives you an idea of where the stock is currently trading in relation to its current average. So if a stock is trading way above it’s average, then it could mean the stock will soon head lower or at least slow down a bit and vice versa.
Volume
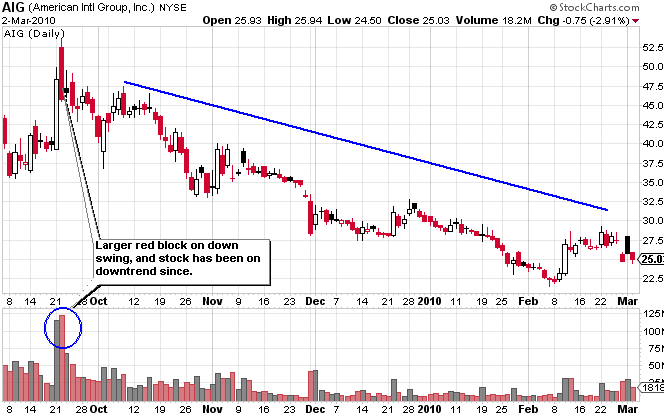
Each stock transaction is essentially an exchange of contracts/shares between buyers and sellers. The number of shares traded in one day represents the volume.
Volume is critical in reading stock charts because it represents the strength on the current price movement. The larger the volume, the more significant the move.
Building on this idea, if a stock crosses a line of resistance, then we would like to see it happen on larger than normal volume. The higher the volume during that price move the more significant the move.
Price Targets
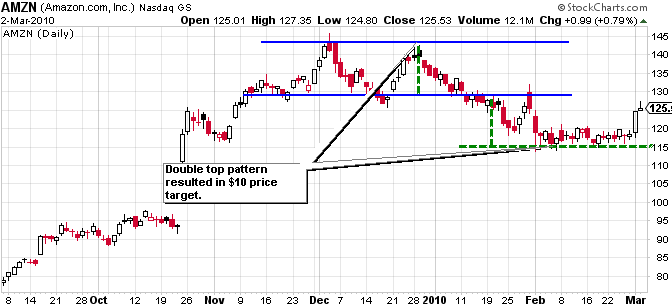
By analyzing a stock chart and using relevant patterns, we should get a good idea of where the stock is heading. This is called our price target. It is the point at which we feel the initial trade has succeeded and its time to either take your profit or re-analyze your position.
Because technical analysis is the process of using historical trends, most price targets are derived through simple pattern recognition using symmetrical analysis. As a rough example, if the bottom of a pattern was 4 points (20) from it’s resistance (24), then a break should result in another 4 point run above the resistance (28 = price target).
Using this same theory, if it took a month for the pattern to develop below the resistance, then we should expect another month for it to reach its additional 4 point price target once it breaks above the resistance.
Obviously this won’t always result with such pinpoint accuracy, but it gives you a good idea of what to expect.
Stop Losses
Just like we create price targets that determine when our trade is a success there are stop losses, which determine when our trade is a failure.
A stop loss is a point underneath your buy point. This is a point that, if crossed below, you consider the trend for which you based your trade on to be broken.
The stop loss is a preventative measure to assure that you don’t lose more money than necessary and keeps your risk to a minimum. Stop losses are usually what drive people to use technical analysis over fundamental analysis.


